C++ Profiling


We use compiled languages like C++, Rust or Fortran to get good performance, so measuring and understanding the performance characteristics of our code is vital, for example to identify bottlenecks or to determine if a change to the code actually improves the performance. In this course we will cover different ways to profile and benchmark the performance of our code, and discuss the pros and cons of each method. Code examples will be in C++ but the profiling applies to most compiled languages.
Slides
| download slides as pdf | download course description as pdf |
Getting started
To clone the repo and compile the code:
git clone --recursive https://github.com/ssciwr/cpp-benchmarking.git
cd cpp-benchmarking
mkdir build
cd build
cmake -DCMAKE_BUILD_TYPE=Release ..
cmake --build .
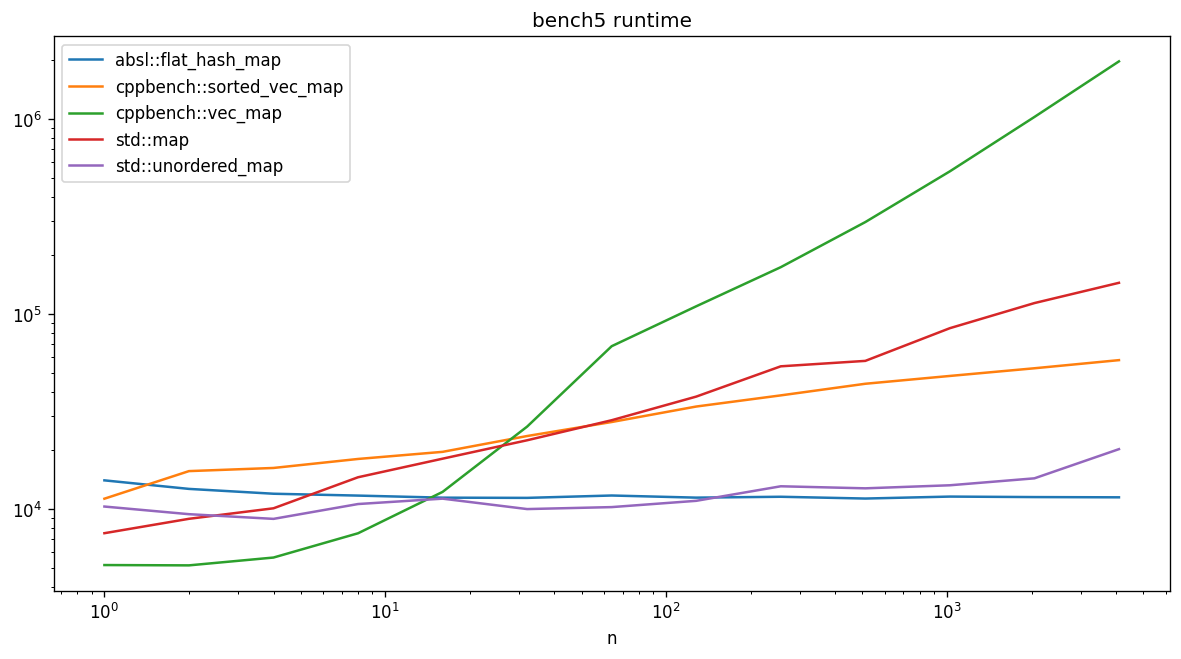
This code contains two very simple map implementations, vec_map and sorted_vec_map, along with benchmarks of these and other map implementations.
Micro-benchmarks
- bench contains some micro-benchmarks using the Google Benchmark library
- plots contains some sample output & plots of these benchmarks and a simple Python script to make the plots
Profiling
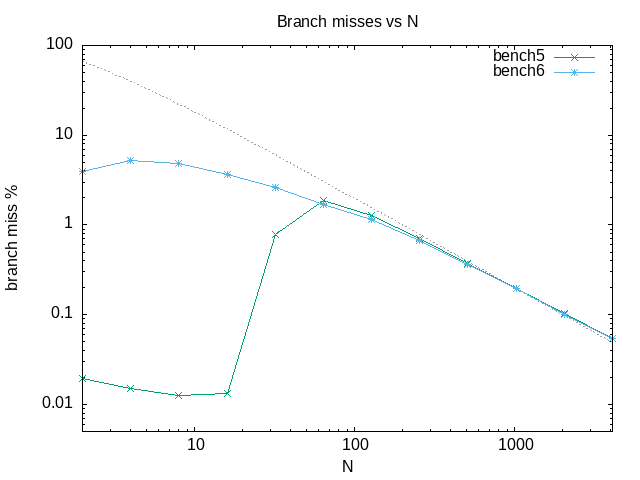
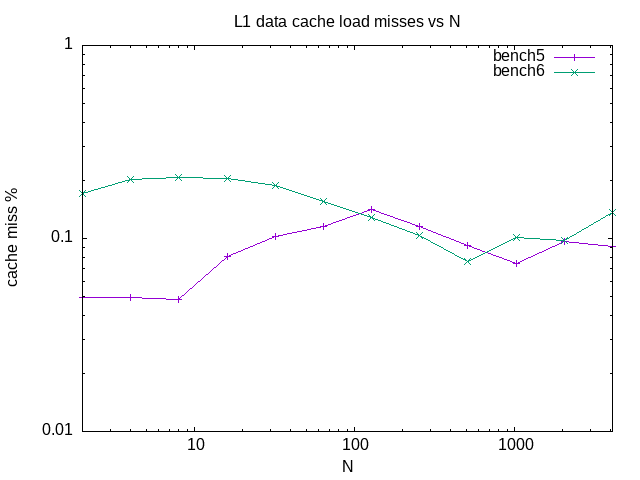
- perf contains some scripts and plots using perf to profile performance
Simulation
Acknowledgements
This repo was quickly set up using the SSC C++ Project Cookiecutter.